
Transactions on Cryptographic Hardware and Embedded Systems 2026
Improving the Selection Rule of Correlation Attacks for Remote Power Analysis
README
Improving the Selection Rule of Correlation Attacks
This repository contains datasets and scripts for the experiments reported in [1]. If you find these resources useful, please cite the paper!
I. Requirements
Hardware
The artifact provides datasets obtained from physical devices which can be used to reproduce the results in the paper. However, if you wish to set your own experiment, here we list the specifications:
- Computer:
- Intel Core i9-13900H/64GB/1TB
- Please note that some experiments process a lot of data and thus your RAM memory and processor will impact the runtime.
- For remote trace acquisition:
- AMD Zynq-7000 ARM/FPGA SoC Development Board
- We set the hardware following the SCAbox project, they provide all the RTL sources.
- For the conventional acquisition:
- NewAE CW305-A35 Artix FPGA Target
- NewAE CW1173 ChipWhisperer-Lite
- We set the hardware following the NewAE tutorials, they provide all the RTL sources.
Software
This artifact provides datasets which can be analyzed externally. And we also provide scripts which can be used to reproduce the results shown in the paper. For the most part we rely on Matlab.
- MATLAB: + The Parallel Computing Toolbox is used to speed up computations, however the parallelized loops can be removed. + We have used different versions of MATLAB to work with the dataset without any issues. The earliest being R2024a and the latest R2025b.
- We use a third party implementation of AES in MATLAB which can be retrieved from github.
- Python: + We provide a python script for trace acquisition using the ChipWhisperer, these are some of the dependencies: + chipwhisperer, PyCryptodome, numpy, os, time, datetime
II. Reproducing the results in the paper
Here we provide short tutorials on how to use the scripts in the dataset to reproduce the results shown in the paper.
- The first step to setupt the artifact is to retrieve the AES used in MATLAB. Obtain the sources and place them inside
meanmax/AES_MATLAB/AES_MAT
A. Remote power analysis
- Launch MATLAB and open the
meanmax/RemotePowerAnalysis/Scripts/automatize.mscript. You don't need to change anything, but here are some things you could configure:window_widthis the s parameter described in [1], can go from 1 to 20.projectdiris the dataset under analysis, change this path if you plan to use a different dataset.stepsis the number of points analyed, the script will generate results for all these numbers of traces.num_bytesis the number of bytes under attack. This can be reduced to save time but then the number of repeated experiments will be lower.num_expcan be increased in the case where you have multiple repetitions of an experiment.- If your computer is not powerful enough you can go inside
meanmax/RemotePowerAnalysis/Scripts/cpa.mand modifyc.NumWorkersto reduce the number of threads, or even remove the parallel loop. Otherwise this script does not need to be touched.
- Go to the
EDITORtab of MATLAB and click Run. Select Change Folder if prompted.- The script will take a few minutes to produce the plots shown in Figure 6 of [1].
- If you would like the scripts used to generate Figures 3 to 5 please contact us, they come from the same dataset.
B. Synthetic traces
There are three things that you can do regarding synthetic traces. You can generate a new dataset, analyze an available dataset, or simply replot the results.
[OPTIONAL] Generate a new dataset
- This step is optional since the artifact already contains a functional dataset.
- Launch MATLAB and open the
meanmax/SyntheticTraces/Scripts/generate.mscript. You don't need to change anything, but here are some things you could configure:algoandmodedon't affect anything, these are just names used for labeling.Mis the number of repetitions for the experiment.Nis the number of messages or traces.num_samplesis the number of samples in a synthetic trace.betasis a list of values to be used for the parameter Beta as defined in [1].alphasis a list of values to be used for the parameter Alpha as defined in [1].- If your computer is not powerful enough you can modify
c.NumWorkersto reduce the number of threads, or even remove the parallel loop.
- Go to the
EDITORtab of MATLAB and click Run. Select Change Folder if prompted.- The script can take up to a couple hours to produce the new dataset.
Analyze a dataset
- Launch MATLAB and open the
meanmax/SyntheticTraces/Scripts/automatize.mscript. You don't need to change anything, but here are some things you could configure:betasshould include somebetasavailable in the dataset you want to process.alphasshould include somealphasavailable in the dataset you want to process.window_widthis the s parameter described in [1], can go from 1 tonum_samples.projectdiris the dataset under analysis, change this path if you plan to use a different dataset.stepsis the number of points analyed, the script will generate results for all these numbers of traces.num_bytesis the number of bytes under attack. This can be reduced to save time but then the number of repeated experiments will be lower.num_expsis the number of repetitions for an experiment.- If your computer is not powerful enough you can go inside
meanmax/SyntheticTraces/Scripts/cpa.mand modifyc.NumWorkersto reduce the number of threads, or even remove the parallel loop. Otherwise this script does not need to be touched.
- Go to the
EDITORtab of MATLAB and click Run. Select Change Folder if prompted.- The script can take up to a few hours to analyze the dataset.
Plot the results
- Launch MATLAB and open the
meanmax/SyntheticTraces/Scripts/replot.mscript. You don't need to change anything, but here are some things you could configure:datasetis the dataset under analysis, change this path if you plan to use a different dataset.betasshould match thebetasdefined for analysis.alphasshould match thealphasdefined for analysis.stepsshould match thestepsdefined for analysis.num_bytesshould match thenum_bytesdefined for analysis.num_expsshould match thenum_expsdefined for analysis.
- Go to the
EDITORtab of MATLAB and click Run. Select Change Folder if prompted.- The script will take a few seconds to produce the plots shown in Figures 7, 8, 14, 15 of [1].
C. Real power traces
There are four things that you can do regarding real traces. You can capture a new dataset, misalign an available dataset, analyze an available dataset, or simply replot the results.
[OPTIONAL] Generate a new dataset
- This step is optional since the artifact already contains a functional dataset.
- Connect your hardware as described in the NewAE tutorial
- Using some code editor open
meanmax/ChipWhisperer/Acquisition/capture.py, here are some things you could configure:scope.adc.samplesis the number of samples in the power trace.scope.gain.dbis the input gain.bsfileis the bitstream for the NewAE CW305. Note that we provide a bitrstream for the CW305-A35.target.pll.pll_outfreq_set(4E6, 1)defines the victim frequency.scope.clock.clkgen_mul = 24defines the number of samples per cycle. Please note that these parameters are related.algoandmodedon't affect anything, these are just names used for labeling.Mis the number of repetitions for the experiment.Nis the number of messages or traces.
- From a terminal execute
python capture.py
If all is working properly, in a few minutes you should have captured a new set of traces.
[OPTIONAL] Misalign an available dataset
- This step is optional since the artifact already contains a functional misaligned dataset.
- Launch MATLAB and open the
meanmax\ChipWhisperer\Scripts\misalign.mscript. You don't need to change anything, but here are some things you could configure:betasis a list of values to be used for the parameter Beta as defined in [1].num_expsshould match theMdefined for the dataset you want to misalign.projectdiris the dataset under analysis, change this path if you plan to use a different dataset.
- Go to the
EDITORtab of MATLAB and click Run. Select Change Folder if prompted.- The script can take up to a couple hours to produce the new misaligned dataset.
Analyze a dataset
- Launch MATLAB and open the
meanmax/ChipWhisperer/Scripts/automatize.mscript. You don't need to change anything, but here are some things you could configure:betasshould include somebetasavailable in the dataset you want to process.window_widthis the s parameter described in [1], can go from 1 toscope.adc.samples.projectdiris the dataset under analysis, change this path if you plan to use a different dataset.stepsis the number of points analyed, the script will generate results for all these numbers of traces.num_bytesis the number of bytes under attack. This can be reduced to save time but then the number of repeated experiments will be lower.num_expsis the number of repetitions for an experiment.
- Go to the
EDITORtab of MATLAB and click Run. Select Change Folder if prompted.- The script will take a few minutes to analyze the dataset.
Plot the results
- Launch MATLAB and open the
meanmax/ChipWhisperer/Scripts/replot.mscript. You don't need to change anything, but here are some things you could configure:datasetis the dataset under analysis, change this path if you plan to use a different dataset.betasshould match thebetasdefined for analysis.stepsshould match thestepsdefined for analysis.num_bytesshould match thenum_bytesdefined for analysis.num_expsshould match thenum_expsdefined for analysis.
- Go to the
EDITORtab of MATLAB and click Run. Select Change Folder if prompted.- The script will take a few seconds to produce the plots shown in Figures 12 and 16 of [1].
III. Dataset structure
This artifact is made of three main parts, which correspond to Sections 4, 5, and 6 of [1]. Here we ilustrate the overall distribution of the files and in the following we provide brief descriptions.
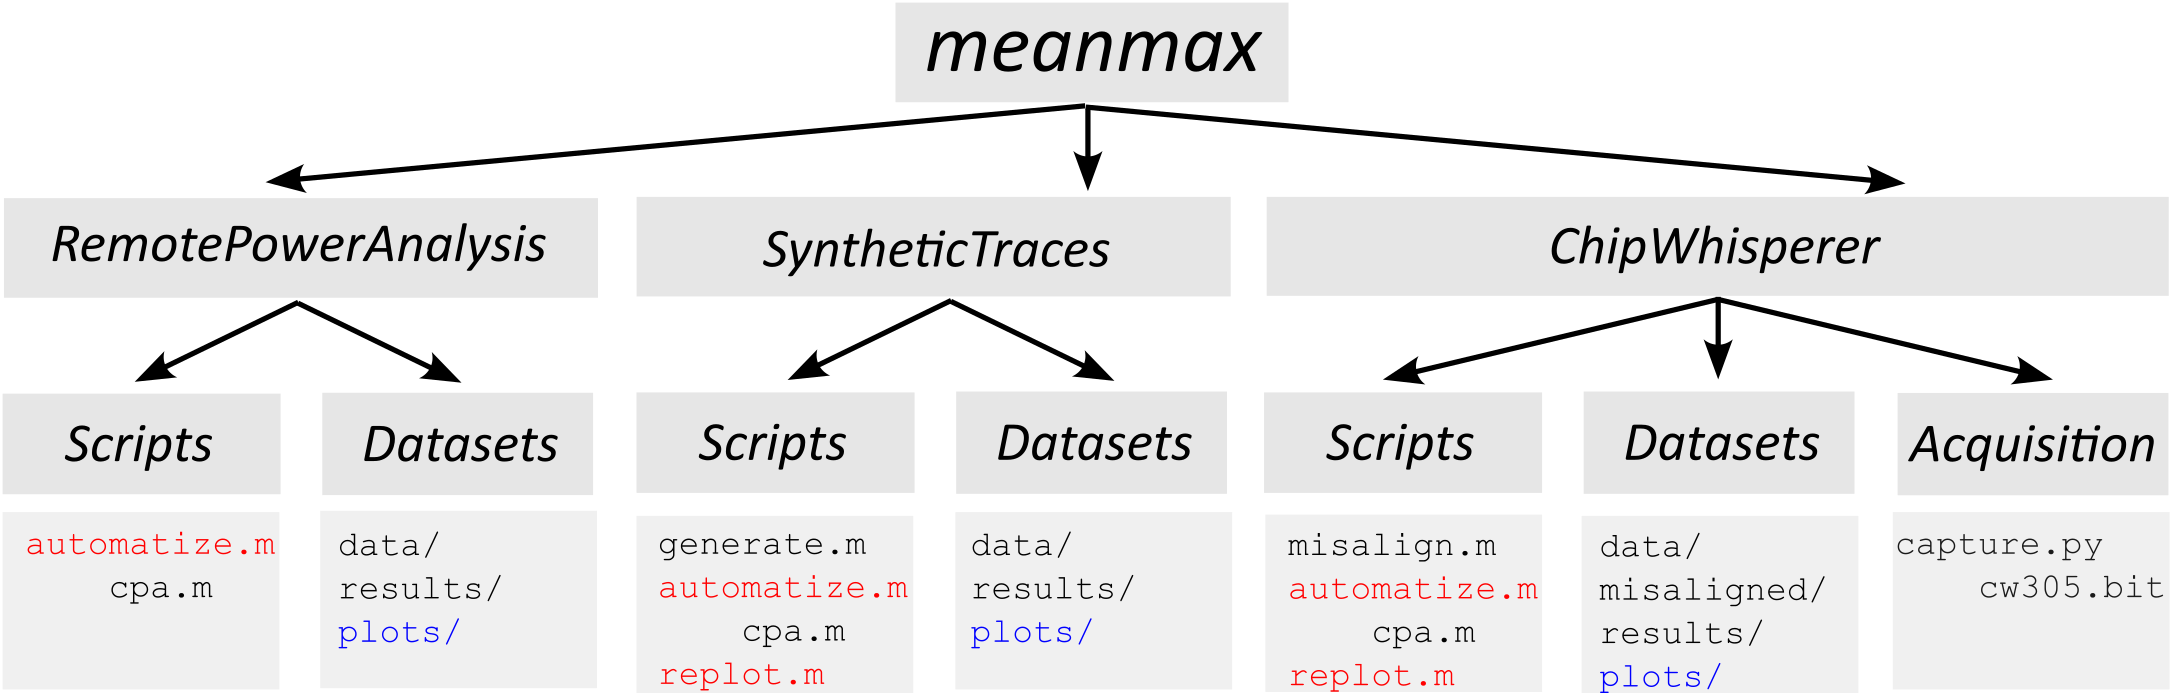
A. Remote power analysis
In this experiment we study the characteristics of RPA traces and propose a novel selection rule which can improve CPA according to the performance indicators described in the paper.
Sensor: 8xTDC@200MHz implemented in the FPGA of an AMD-Xilinx Zynq-7000
Victim: Iterative AES128@10MHz implemented in the FPGA of an AMD-Xilinx Zynq-7000
Datasets
-
AES128_ENC_1x100000: 1 instance with 100,000 power traces from the AES128 encryption.
- exp_i/pt.csv: Plaintexts.
- exp_i/ct.csv: Ciphertexts.
- exp_i/k.csv: Encryption key.
- exp_i/t.csv: Power traces.
-
AES128_ENC_1x100000_res: CSV files with the attack results (success rate).
- argmax_correct.csv: Number of bytes recovered by CPA+argmax.
- argmax_d1.csv: Distance d1 for CPA+argmax.
- argmax_d2.csv: Distance d2 for CPA+argmax.
- argmax_r.csv: Cluster mean for CPA+argmax.
- meanmax_correct.csv: Number of bytes recovered by CPA+meanmax.
- meanmax_d1.csv: Distance d1 for CPA+meanmax.
- meanmax_d2.csv: Distance d2 for CPA+meanmax.
- meanmax_r.csv: Cluster mean for CPA+meanmax.
- meanmax_correct_C1.csv: CPA+meanmax recovered bytes and improved C1.
- meanmax_correct_C2.csv: CPA+meanmax recovered bytes and improved C2.
-
AES128_ENC_1x100000_fig: Plots shown in the paper.
- distance_second_hypothesis.eps: Figure 6 (a)
- distance_cluster_mean.eps: Figure 6 (b)
Scripts
- automatize.m: Configures the attack, stores the results and plots the figures.
- cpa.m: Performs CPA on 16 bytes of the given dataset, used by automatize.m
B. ChipWhisperer
We use the NewAE ChipWhisperer capture system to acquire conventional power traces. We use these data to de-synchronize controlled subsets of traces and study their impact on the proposed attack.
Sensor: ChipWhisperer-Lite@96MHz
Victim: Iterative AES128@4MHz implemented in the FPGA of a NewAE CW350-35T
Datasets
-
AES128ENC_10x5000[...]: 10 instances with 5,000 power traces from the AES128 encryption.
-
AES128ENC_10x5000[...]_mis: For each dataset i, up to B=50% of the traces are misaligned.
-
AES128ENC_10x5000[...]_res: CSV files with the attack results (success rate).
- argmax_correct.csv: Number of bytes recovered by CPA+argmax.
- meanmax_correct.csv: Number of bytes recovered by CPA+meanmax.
- meanmax_correct_C1.csv: CPA+meanmax recovered bytes and improved C1.
- meanmax_correct_C2.csv: CPA+meanmax recovered bytes and improved C2.
-
AES128ENC_10x5000[...]_fig: Plots shown in the paper.
- argmax_correct.eps: Figure 16 (a)
- meanmax_correct.eps: Figure 16 (c)
- meanmax_correct_C1.eps: Figure 12 (a)
- meanmax_correct_C2.eps: Figure 12 (b)
Scripts
- misalign.m: Generates [...]_mis
- automatize.m: Configures the attack and stores the results in [...]_res
- cpa.m: Performs CPA on 16 bytes of the given dataset, used by automatize.m
- replot.m: Generates [...]_fig
Acquisition
- capture.py: Generates a dataset of power traces.
- cw305.bit: Configuration file for the CW305-35T, used by capture.py
C. Synthetic traces
Lastly, we generate synthetic traces to control the misalignment rate (B) and the noise gain (a).
Datasets
-
AES128ENC_10x100000[...]: 10 instances with 100,000 power traces following Eq. (6). The misalignment rate varies up to B=50 and the noise gain varies up to a=2.5.
-
AES128ENC_10x100000[...]_res: CSV files with the attack results (success rate).
- B_i/argmax_correct.csv: Number of bytes recovered by CPA+argmax.
- B_i/meanmax_correct.csv: Number of bytes recovered by CPA+meanmax.
- B_i/meanmax_correct_C1.csv: CPA+meanmax recovered bytes and improved C1.
- B_i/meanmax_correct_C2.csv: CPA+meanmax recovered bytes and improved C2.
-
AES128ENC_10x100000[...]_fig: Plots shown in the paper.
- B_i/argmax_correct.eps: Figure 14 (a-d)
- B_i/meanmax_correct.eps: Figure 15 (a-d)
- B_i/meanmax_correct_C1.eps: Figure 7 (a-d)
- B_i/meanmax_correct_C2.eps: Figure 8 (a-d)
Scripts
- generate.m: Generates the main dataset.
- automatize.m: Configures the attack and stores the results in [...]_res
- cpa.m: Performs CPA on 16 bytes of the given dataset, used by automatize.m
- replot.m: Generates [...]_fig
References
[1] Farràs, O., Grosso, V., Guiot, M., & Lara-Nino, C. A. (2026). Improving the Selection Rule of Correlation Attacks for Remote Power Analysis. IACR Transactions on Cryptographic Hardware and Embedded Systems, 2026(1), 402-424. 10.46586/tches.v2026.i1.402-424
@article{FGGL26,
    title   = {Improving the Selection Rule of Correlation Attacks for Remote Power Analysis},
    author  = {Farras, Oriol and Grosso, Vincent and Guiot, Miquel and Lara-Nino, Carlos Andres},
    journal = {IACR Transactions on Cryptographic Hardware and Embedded Systems},
    doi     = {10.46586/tches.v2026.i1.402-424},
    volume  = {2026},
    number  = {1},
    year    = {2026},
    month   = {Jan.},
    pages   = {402–424}}